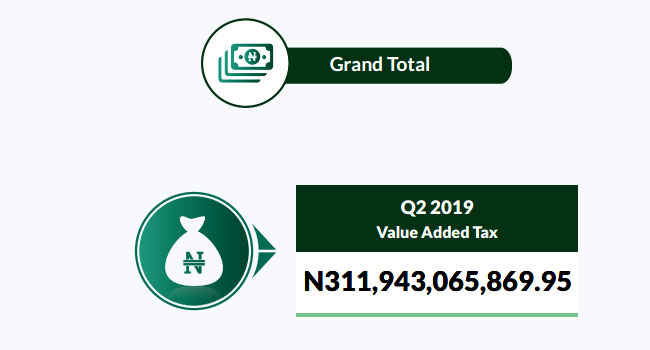

The Nigerian Government has generated the sum of N311.94 billion from Value Added Tax (VAT) in the second quarter of 2019.
The National Bureau of Statistics (NBS) disclosed this in a report titled ‘Sectoral Distribution Of Value Added Tax (Q2 2019)’ published on Tuesday.
In the report, the figure generated in the Q2 is higher than the N289.04 billion generated in the first quarter of the year in review.
It revealed that other manufacturing generated the highest amount of VAT with a sum of N34.43billion.
READ ALSO: Beware Of Fraudulent Loan Offers, CBN Warns Nigerians
According to the NBS, this is closely followed by Professional Services which generated N29.58bn, while Commercial and Trading generated N16.27bn and Mining generated the least with a figure of N50.60millon.
The agency explained that the data used in preparing the report were provided by the Federal Inland Revenue Service (FIRS) and verified and validated by the NBS.
The Executive Summary of the report read:
Sectoral distribution of Value Added Tax (VAT) data for Q2 2019 reflected that the sum of N311.94bn was generated as VAT in Q2 2019 as against N289.04bn generated in Q1 2019 and N269.79bn generated in Q2 2018 representing 7.92% increase QoQ and 16.95% increase YoY.
Other manufacturing generated the highest amount of VAT with N34.43bn generated and closely followed by Professional Services generating N29.58bn, Commercial and Trading generating N16.27bn while Mining generated the least and closely followed by Pharmaceutical, Soaps & Toiletries and Textile and Garment Industry with N50.60mln, N250.09mln and N316.91mln generated respectively.
Out of the total amount generated in Q2 2019, N151.56bn was generated as Non-Import VAT locally while N94.90bn was generated as Non-Import VAT for foreign. The balance of N65.48bn was generated as NCS-Import VAT.
Also, see the table below:
| Q1 2019 | Q2 2019 * | Quarter on Quarter % | Year on Year % | |
| Classification | Value Added Tax | Value Added Tax | Q1 2019 / Q2 2019 | Q2 2019 / Q2 2018 |
| Agricultural and Plantations | 627,309,855.38 | 738,117,007.17 | 17.66 | (5.54) |
| Automobiles and Assemblies | 421,443,588.76 | 481,438,702.64 | 14.24 | (1.50) |
| Banks & Financial Institutions | 4,195,911,497.61 | 4,060,359,569.91 | (3.23) | (14.47) |
| Breweries.Bottling and Beverages | 10,835,290,704.46 | 11,272,962,075.34 | 4.04 | 19.49 |
| Building and Construction | 2,744,836,873.65 | 2,400,570,624.59 | (12.54) | (10.14) |
| Chemicals, Paints and Allied Industries | 522,706,937.42 | 543,426,279.34 | 3.96 | 71.35 |
| Commercial and Trading | 14,924,509,446.19 | 16,269,201,434.21 | 9.01 | 1.00 |
| Conglomerates | 1,512,442,362.40 | 1,047,208,422.52 | (30.76) | (7.99) |
| Federal Ministries & Parastatals | 7,937,268,043.87 | 8,109,935,510.66 | 2.18 | 46.15 |
| Gas | 1,529,466,433.36 | 1,074,711,768.56 | (29.73) | (15.33) |
| Hotels and Catering | 1,615,988,078.22 | 2,124,908,064.49 | 31.49 | 31.38 |
| Local Government Councils | 507,277,849.92 | 495,197,499.61 | (2.38) | 36.79 |
| Minning | 59,884,887.89 | 50,598,095.44 | (15.51) | 5.74 |
| Not Available | 4,016,993,631.69 | 3,768,879,140.15 | (6.18) | (1.89) |
| Offshore Operations | 529,173,488.54 | 657,941,208.43 | 24.33 | 20.22 |
| Oil Marketing | 2,340,806,300.43 | 1,996,390,157.13 | (14.71) | 15.43 |
| Oil Producing | 8,490,827,446.86 | 7,811,745,534.66 | (8.00) | (0.33) |
| Other Manufacturig | 31,423,299,458.75 | 34,429,042,995.83 | 9.57 | 6.07 |
| Petro-Chemical and Petroleum Refineries | 956,166,806.78 | 1,198,575,081.52 | 25.35 | (15.91) |
| Pharmaceutical,Soaps and Toileteries | 201,580,318.33 | 250,092,740.05 | 24.07 | 63.03 |
| Pioneering | 3,522,672,251.92 | 2,361,324,014.43 | (32.97) | 16.69 |
| Professional Services | 24,315,013,565.66 | 29,583,674,334.79 | 21.67 | 47.79 |
| Properties and Investments | 940,729,119.25 | 1,058,623,649.02 | 12.53 | (1.55) |
| Publishing,Printing, Paper Packaging | 365,182,010.80 | 449,848,248.54 | 23.18 | (14.80) |
| State Ministries & Parastatals | 8,050,491,035.62 | 10,445,379,901.29 | 29.75 | 11.90 |
| Stevedoring, Clearing and Forwarding | 1,743,878,248.89 | 1,132,417,313.43 | (35.06) | (16.71) |
| Textile and Garment industry | 298,137,975.21 | 316,908,615.69 | 6.30 | (8.44) |
| Transport and Haulage Services | 2,434,185,088.46 | 7,432,803,909.43 | 205.35 | 278.15 |
| Sub-Total (Non-Import VAT) Local | 137,063,473,306.32 | 151,562,281,898.87 | 10.58 | 17.33 |
| Non-Import (foreign) VAT | 98,967,007,748.51 | 94,904,294,115.91 | – 4.11 | 16.92 |
| NCS-Import VAT | 53,007,856,392.82 | 65,476,489,855.17 | 23.52 | 16.12 |
| Grand Total | 289,038,337,447.65 | 311,943,065,869.95 | 7.92 | 16.95 |